FixMenu analyzes your menu, costs, and online orders — then tells you
exactly where you're losing money and how to fix it.
Built for Indian restaurants, cloud kitchens, and takeaway brands.
🇮🇳
Built for Indian restaurants
🧑🍳
Hospitality-focused
📍
Made in Chennai
🔒
Secure & private
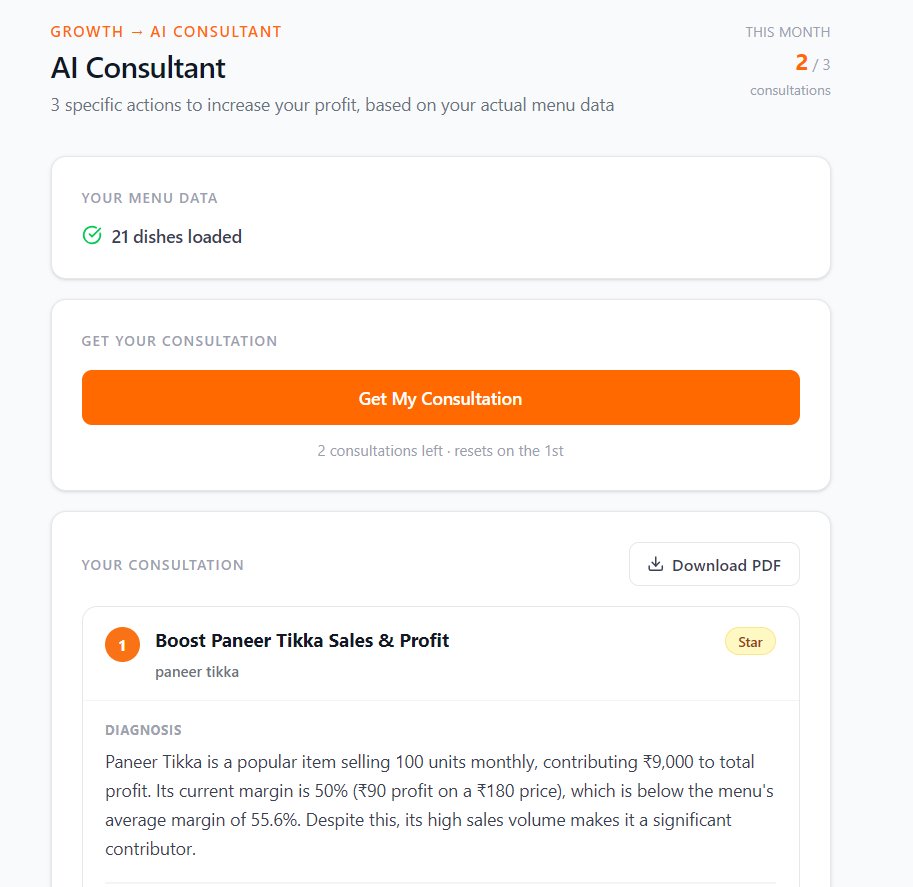
AI Consultant
More than a calculator. A consultant.
Other tools give you numbers. FixMenu gives you decisions.
Get specific, dish-level recommendations on what to reprice, what to
promote, and what to drop — generated from your actual menu data.
Each consultation includes a diagnosis, root cause, action plan,
and exact pricing math.
✓ Diagnoses why a dish is underperforming
✓ Recommends specific price changes, with math
✓ Identifies your Stars vs Plowhorses
✓ Generates a downloadable PDF action plan
app.getfixmenu.com/growth/ai-consultant
Sound familiar?
The real problems restaurant owners face
Most restaurant owners run on instinct and incomplete data. FixMenu replaces guesswork with clear, AI-backed numbers.
?
Food cost keeps climbing and you can't tell why?
FixMenu
Pinpoints exactly which dishes and ingredients are driving your food cost up — to the rupee.
?
Swiggy & Zomato margins feel unclear?
FixMenu
Shows your true take-home after platform fee, packaging, GST, and ad spend — per dish, per order.
?
Pricing based on guesswork?
FixMenu
Recommends prices backed by your real cost data and target margin — not "what the next guy charges."
?
Losing money on combos & offers?
FixMenu
Stress-tests every combo and discount against your costs before they go live on the menu.
?
Drowning in spreadsheets?
FixMenu
One dashboard replaces 8 messy Excel sheets. Add your menu once. See profit forever.
?
Don't know actual profit per dish?
FixMenu
Calculates true margin per plate, then classifies every dish as Star, Plowhorse, Puzzle, or Dog.
Inside the product
Built for the numbers that actually matter
Every screen in FixMenu answers one question: is this dish making you money — and if not, what should you do about it?
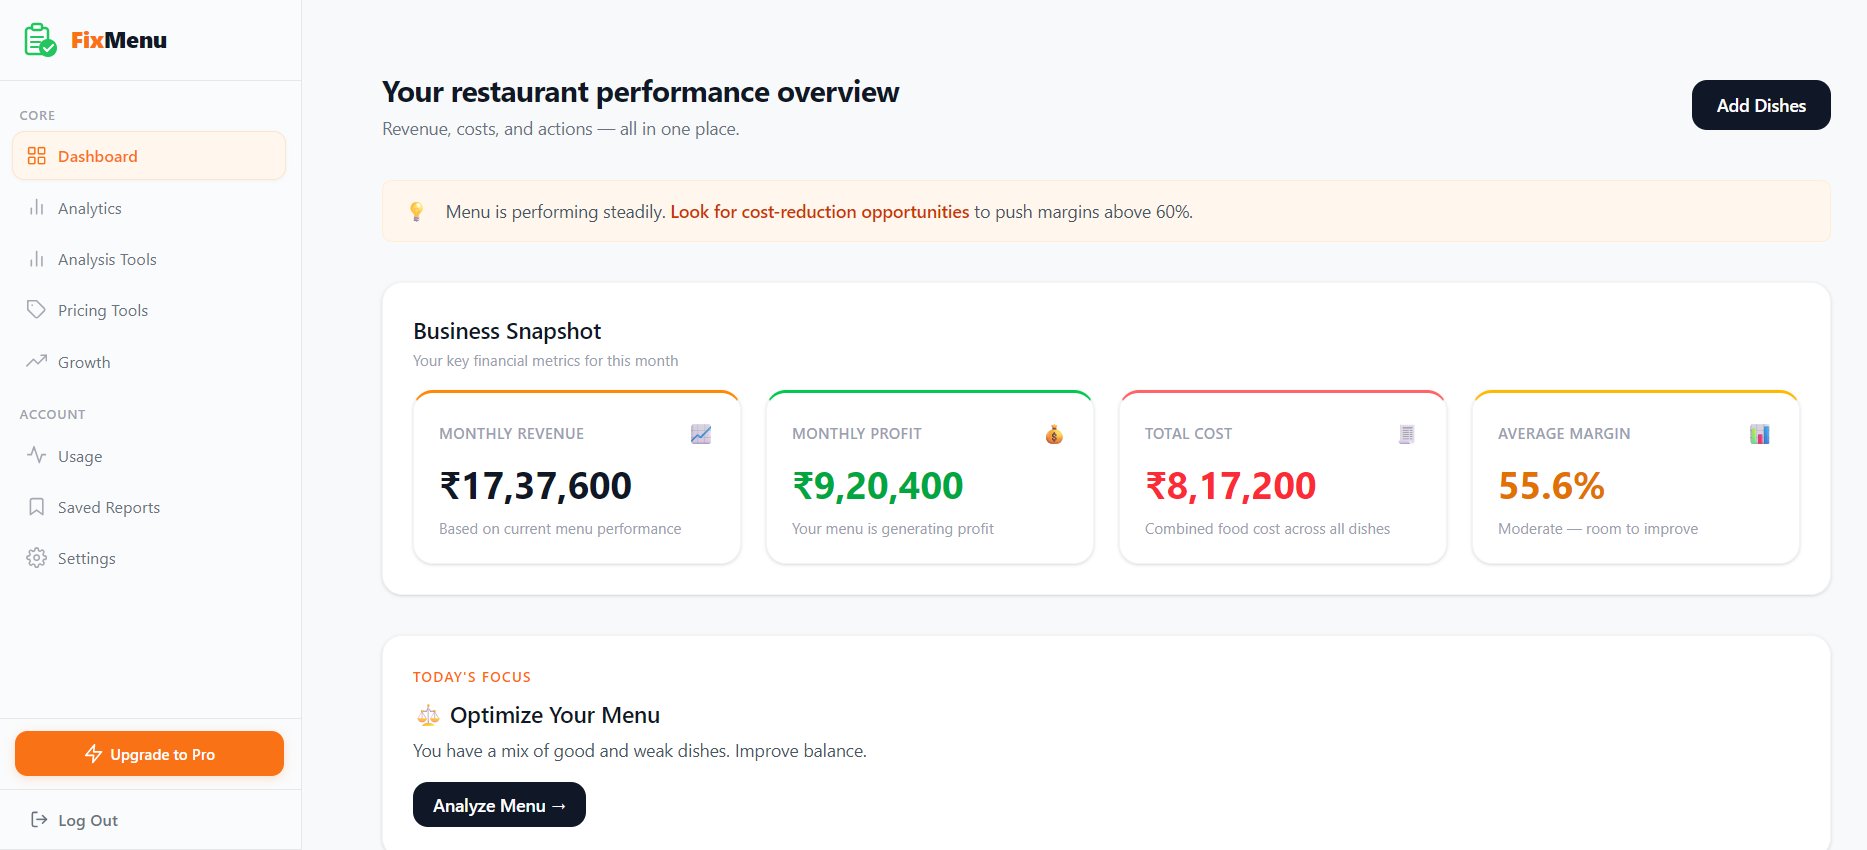
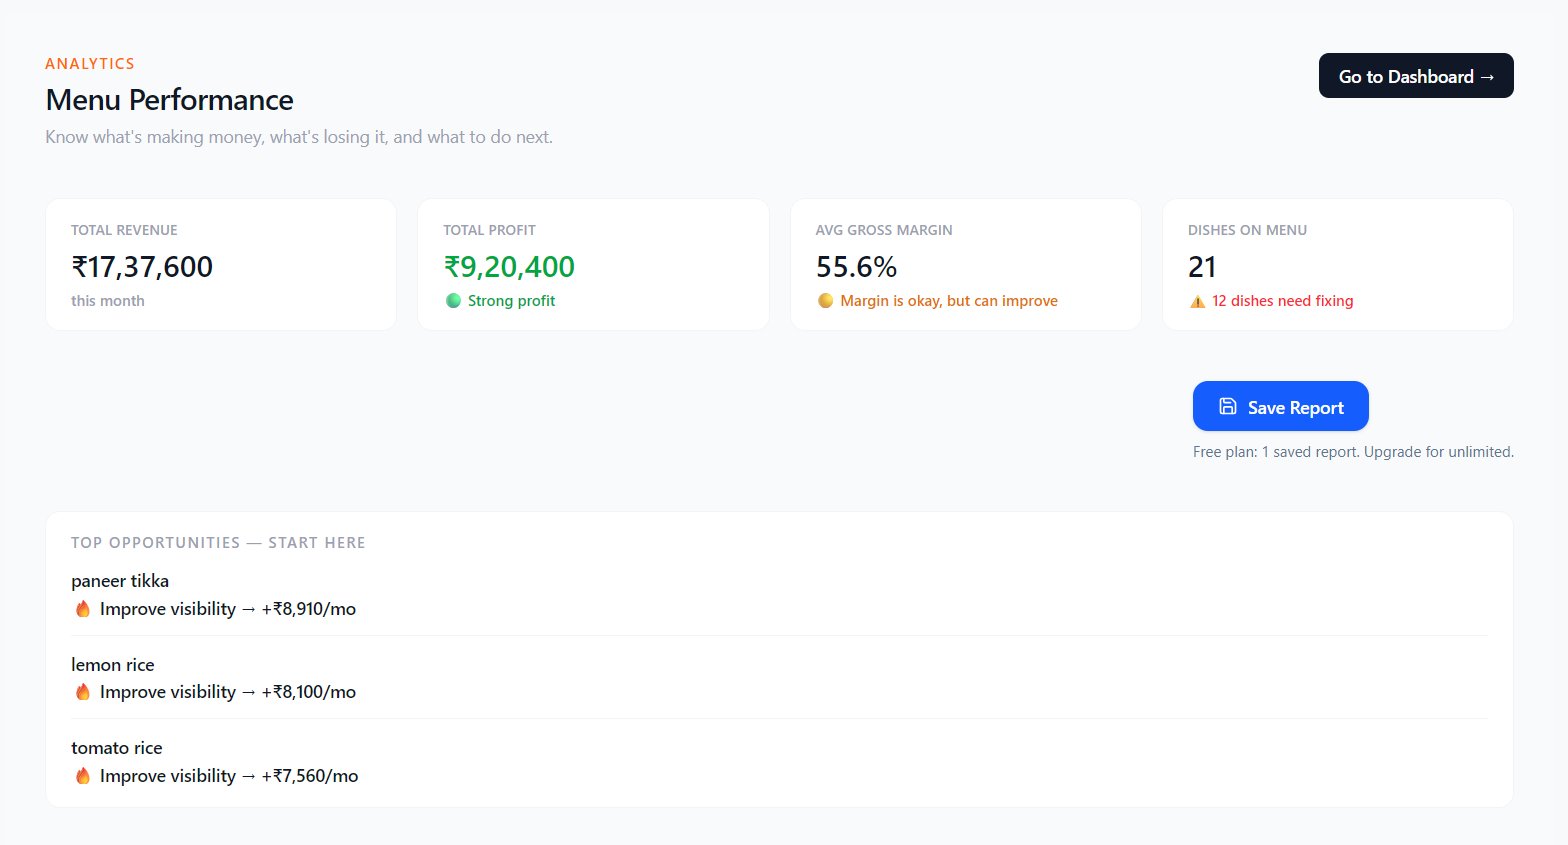
01 · Menu Analytics
Know what's making money, what's losing it.
One screen surfaces your total revenue, profit, gross margin, and
which dishes need fixing. Click into any dish to see exactly how
much more profit it could deliver — and the action that gets you there.
✓ Total revenue, profit & avg gross margin at a glance
✓ Top opportunities ranked by ₹ uplift per month
✓ Spot underperforming dishes before they hurt margins
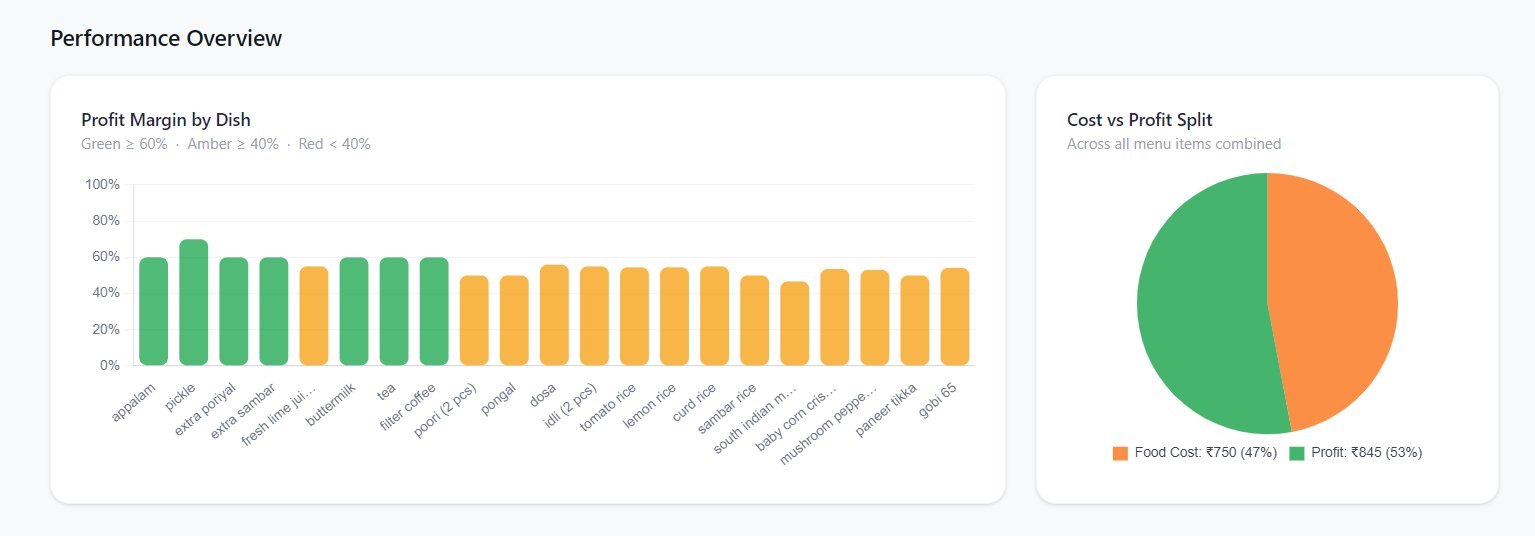
Every dish on your menu, colour-coded by margin band. Green dishes
are pulling their weight. Amber dishes need attention. Red dishes
are leaking profit. No spreadsheets. No formulas.
✓ Visual margin bands: green ≥ 60%, amber ≥ 40%, red < 40%
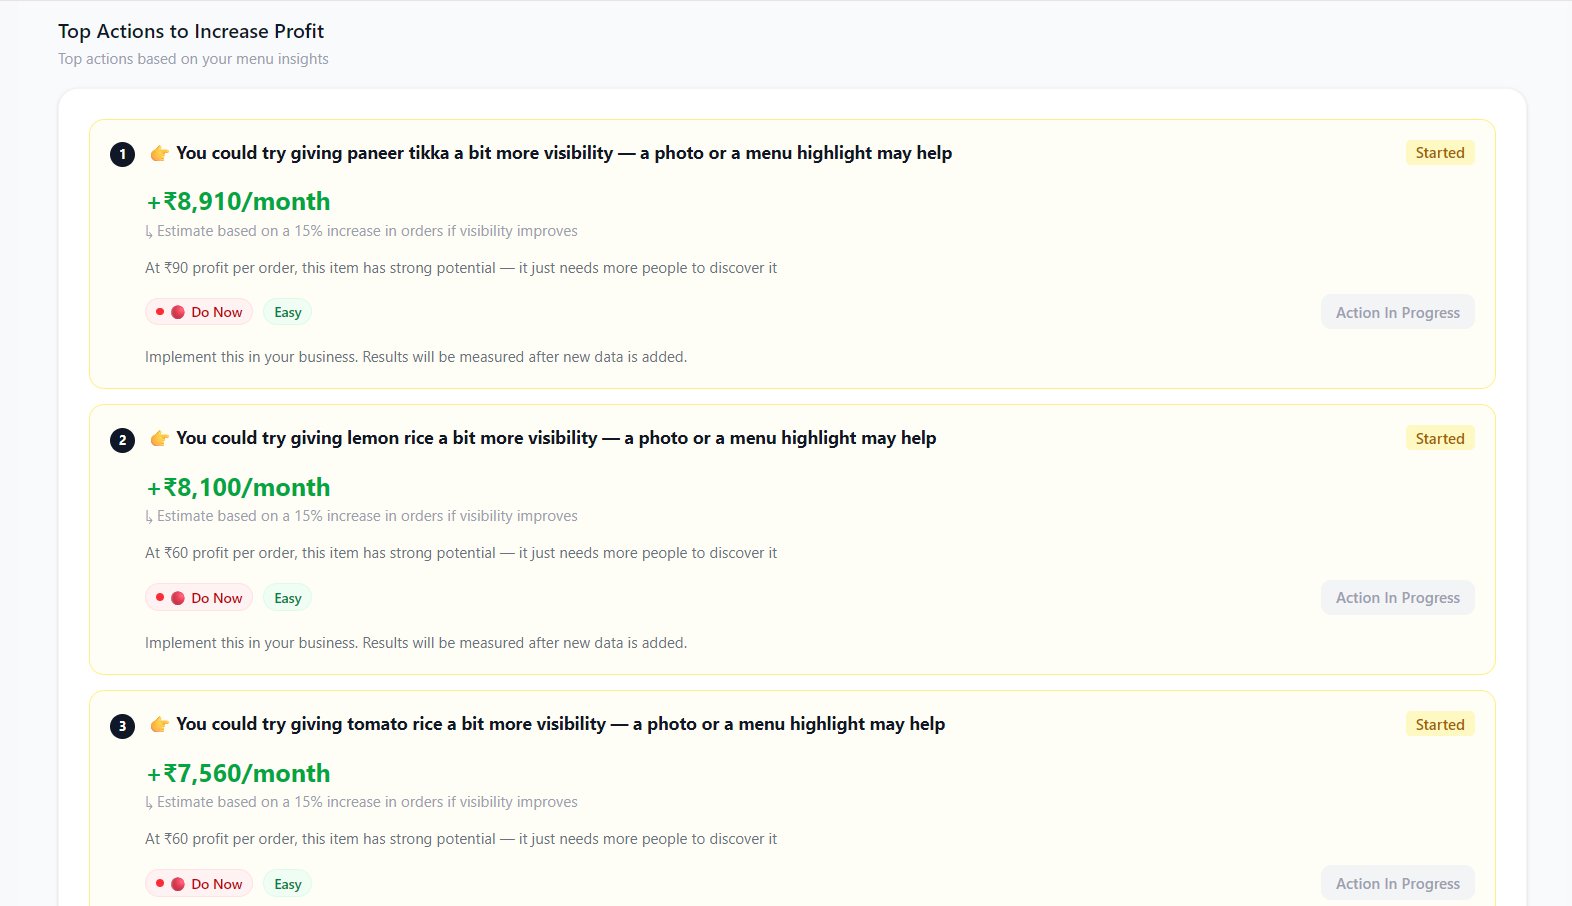
FixMenu doesn't just show you data — it tells you what to do next.
Each recommendation comes with the estimated monthly profit uplift,
difficulty, and a plain-English explanation of why it works.
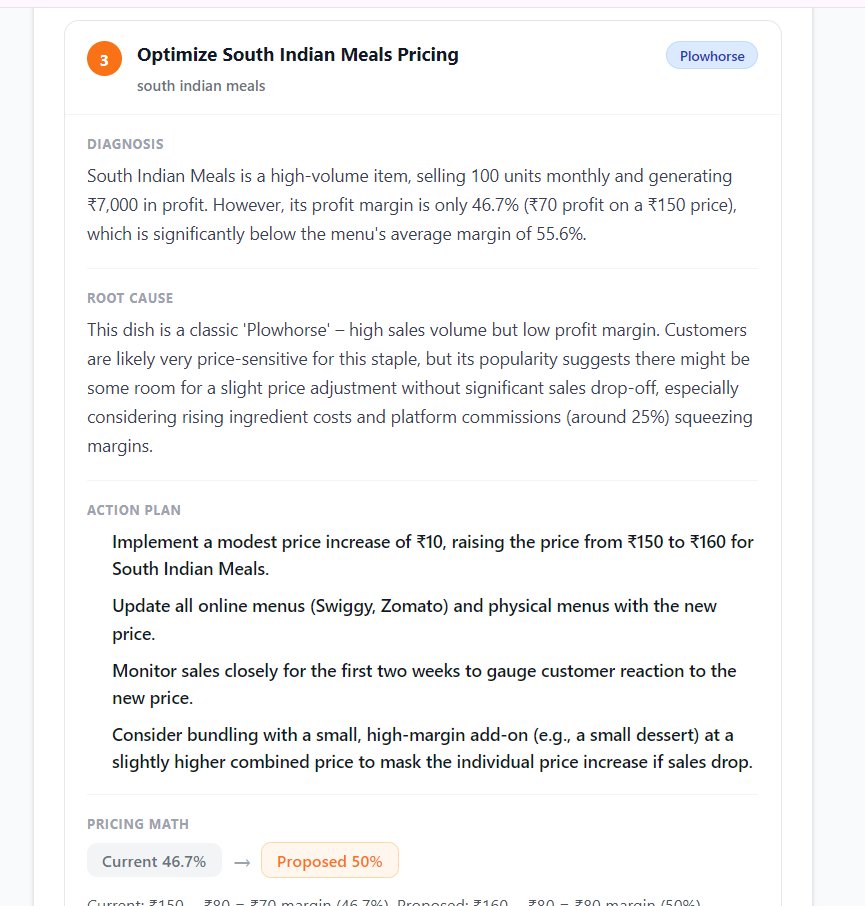
For every recommendation, FixMenu walks you through the diagnosis,
root cause, action plan, and exact pricing math. You see the current
margin, the proposed margin, and the gap closed — before you change
a single price.
Running multiple branches or brands? See them all in one place.
Most restaurant groups manage each branch separately — different sheets, different people, no way to compare.
FixMenu brings every branch into a single dashboard so you can spot problems, compare performance, and act fast.
app.getfixmenu.com/portfolio
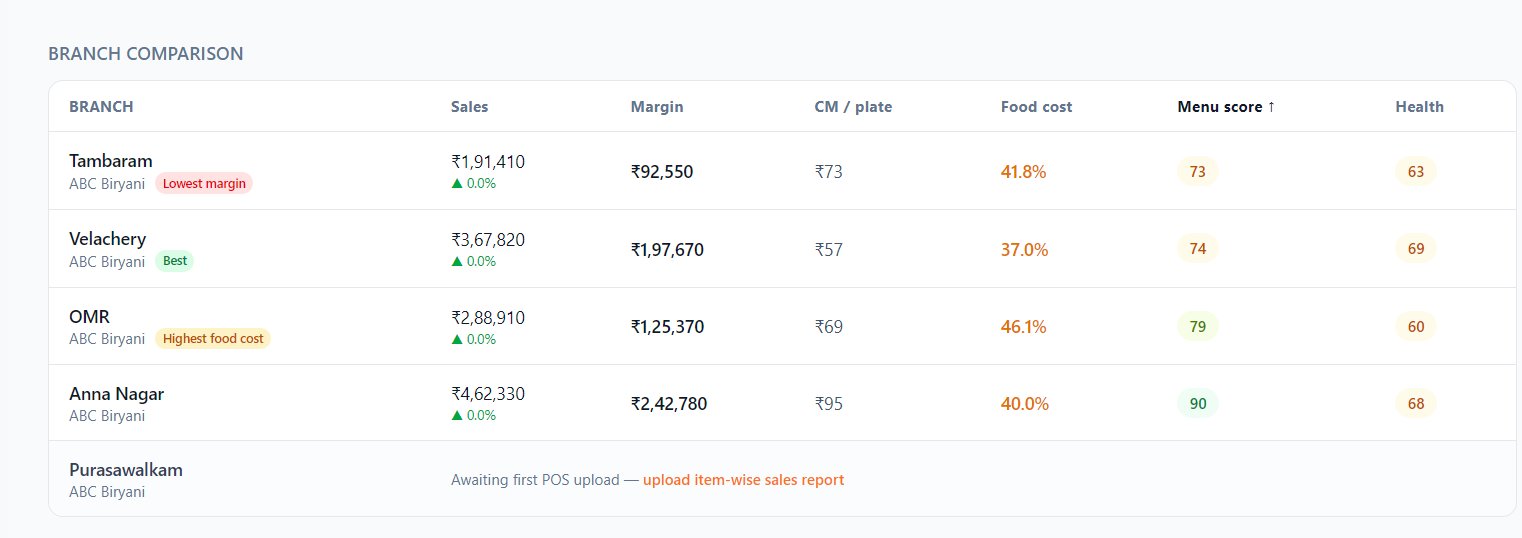
05 · Branch Comparison
Instantly know which branch needs your attention.
One table tells you sales, margin, food cost, menu score, and overall health — sorted by whichever metric matters most today.
Stop guessing which branch is dragging down your blended margin.
✓ Compare food cost, margin, and sales across every branch at a glance
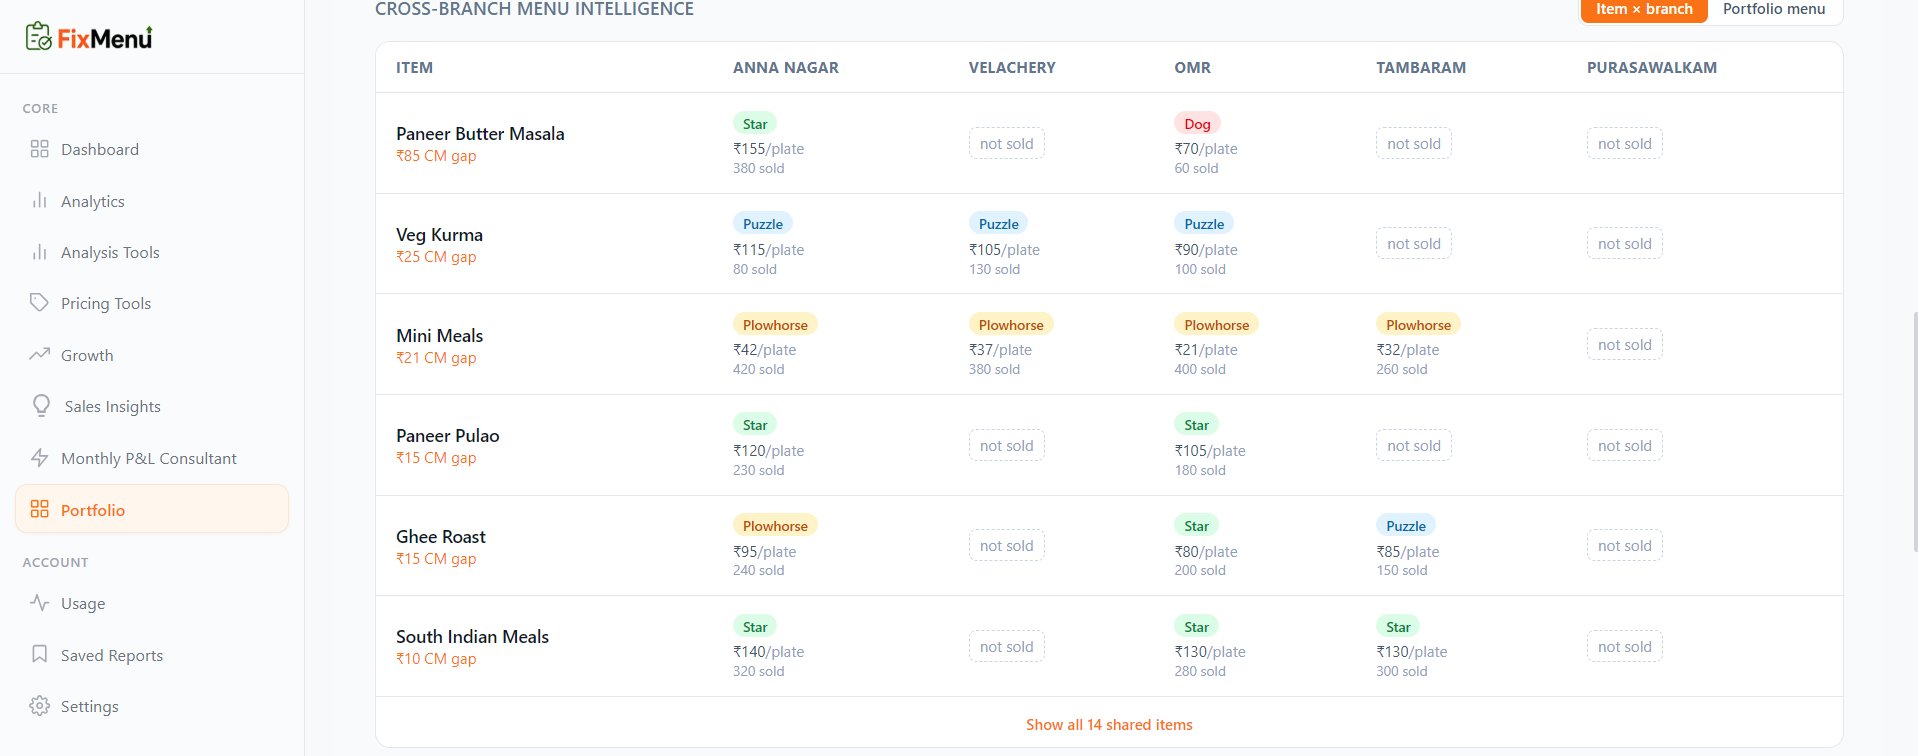
Same dish, five branches — different story everywhere.
Is Paneer Butter Masala a Star in Anna Nagar and a Dog in OMR? That's a pricing problem — and FixMenu catches it automatically.
See how every shared menu item performs across branches, side by side, with classification and contribution margin gap.
✓ Star, Plowhorse, Puzzle, Dog classification per branch — in one grid
✓ CM gap highlights where pricing inconsistency is costing you margin
✓ See which branches are missing high-performing items from their menu
✓ Switch between item-level view and full portfolio menu view
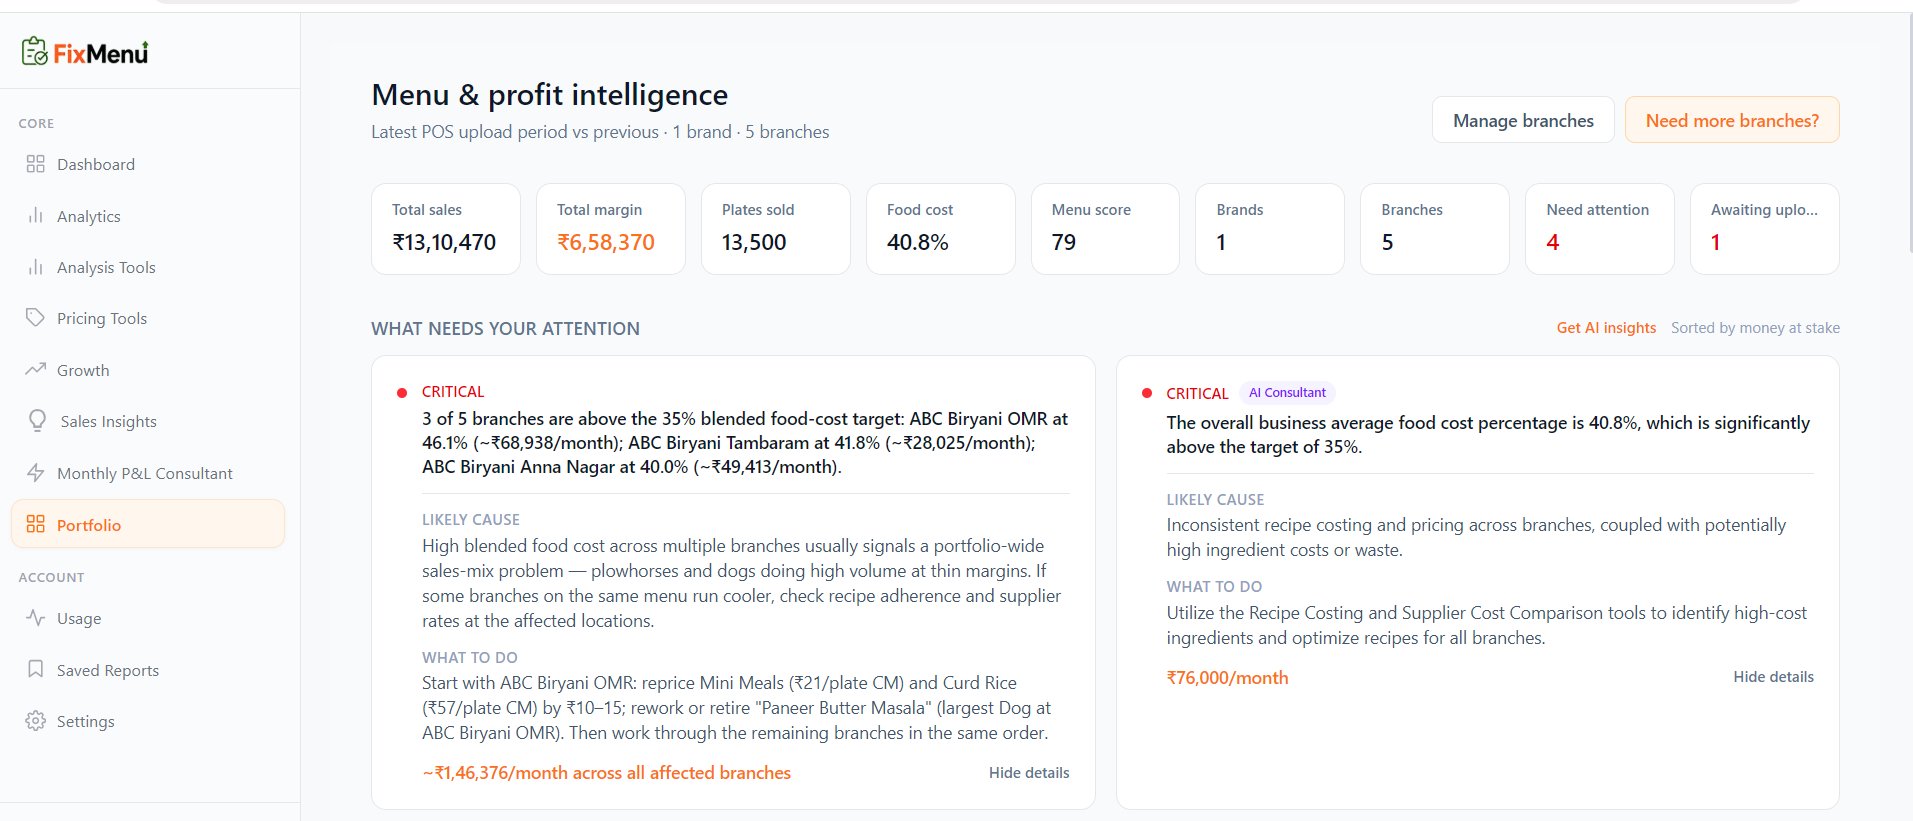
OMR at 46.1%, Tambaram at 41.8%, Anna Nagar at 40.0%. High blended food cost usually signals a sales-mix problem — plowhorses running at high volume with thin margins.
~₹1,46,376/month across affected branches
● Critical · AI Consultant
Blended food cost 5.8% above portfolio target
Inconsistent recipe costing and pricing across branches. FixMenu AI recommends starting with OMR — reprice Mini Meals and retire the Dog item to recover margin fast.
~₹76,000/month recoverable
● Warning
Paneer Butter Masala priced 54% lower in OMR than Anna Nagar
Same dish, ₹85 contribution margin gap between branches. Standardising the pricing floor to ₹130 across all branches recovers margin without changing the recipe.
~₹18,000/month if standardised
● Action
Purasawalkam awaiting first POS upload
Branch is active but no sales data yet. FixMenu will automatically run the full analysis and generate branch-specific recommendations once the first POS report is uploaded.
Upload POS report → get instant insights
Premium Plan · Multi-Brand
Managing multiple brands? Each brand gets its own view.
Running ABC Biryani and GRC under the same roof? FixMenu keeps them separate — each brand has its own branch comparison, its own insights, and its own rollout opportunities. No cross-brand noise.
✨All tools free to try. Upgrade to Pro for advanced features, save, and export. Browse all 14 tools →
How it works
From menu to margin in three steps
No long onboarding. No data migrations. Just add your dishes and start seeing the numbers that matter.
01
📝
Add your menu
Enter dishes with their ingredients and selling prices. Bulk import or add one-by-one — both take minutes.
02
⚙️
FixMenu analyzes
Our AI engine calculates true food cost, profit per dish, and classifies your menu by performance — automatically.
03
📈
Act on insights
Reprice, redesign, or remove dishes with confidence. Track impact week over week from your dashboard.
Who it's for
Built for the way real restaurants run
Whether you're a single outlet or scaling a brand, FixMenu adapts to your model.
🍽️
Restaurants
Independent dine-in restaurants looking to fix margins and price smarter.
☁️
Cloud Kitchens
Delivery-first brands tracking real payout and profit across aggregators.
🥡
Takeaway Brands
QSR and takeaway operators optimizing menu performance at scale.
🇮🇳
Built for India
Designed around Swiggy, Zomato, GST, and how Indian kitchens actually run.
🧑🍳
Hospitality-first
Made for restaurant owners — not accountants. Plain numbers, clear actions.
🤖
AI-powered
Consultant-style recommendations, not just raw calculations.
📍
Made in Chennai
Built in India for Indian restaurants — with support that understands you.
Built for Restaurant Owners
Understand food cost before pricing your menu
Know your actual profit after delivery platform commissions
Find loss-making dishes before they hurt your business
Turn POS reports into actionable insights
Make better decisions without spreadsheets
Built specifically for Indian restaurants
Meet the Founder
Hi, I'm Kaleel Rahman — founder of FixMenu.
I've worked in the restaurant industry since 2020, helping restaurants across Chennai improve their menus, costs, operations, and profitability. Along the way I co-founded 83Hospitality, a restaurant consulting company focused on helping restaurant owners build more successful businesses.
One problem kept showing up: owners losing money without realising it. They were brilliant at food and service, but didn't have the tools to control food cost, price menus correctly, understand delivery platform commissions, or turn POS reports into actionable decisions. The restaurants that succeeded weren't always the ones with the highest sales — they were the ones who understood their numbers.
But good consulting is expensive, and most small and mid-sized restaurant owners can't justify the cost. So I built FixMenu to do what I did as a consultant — only affordable, instant, and available anytime. It helps owners with costing, menu pricing, delivery platform calculations, report analysis, and profitability decisions without spreadsheets or consultant fees.
Think of FixMenu as a pocket restaurant consultant — helping you understand your numbers, protect your margins, and make better decisions before losses happen.
6+ Years in RestaurantsCo-founder, 83HospitalityBuilt in Chennai for Indian Restaurants
Add your menu. Let FixMenu's AI do the math. Get clear answers on
pricing, margins, and waste — and start running a more profitable
restaurant this week.